Every trader, whether beginner or professional, quickly realizes that prices don’t move in straight lines. They rise, fall, and sometimes swing wildly within minutes. This behavior is known as volatility in trading. But what exactly is volatility, why does it matter, and how should traders interpret it?
In this article, we’ll break down what is volatility, explain the difference between historical and implied volatility, and look at why it matters in markets like stocks, forex, and crypto. By the end, you’ll have a clear understanding of market volatility explained in simple terms.
- Definition of Volatility
- Historical vs Implied Volatility
- Historical Volatility (Realized)
- Implied Volatility (Expected)
- Why Volatility Matters for Traders
- Examples: Stocks, Forex, Crypto
- Stocks
- Forex
- Crypto
- Key Takeaways
- FAQ
- What causes volatility?
- Is volatility good or bad for traders?
- Which market is the most volatile?
- Can volatility be predicted?
Definition of Volatility
At its core, volatility measures the degree of variation in the price of a financial instrument over time. In other words, it shows how much and how quickly an asset’s price moves.
- High volatility means prices are changing dramatically in short periods — large upward and downward swings.
- Low volatility means prices are relatively stable, with smaller and slower movements.
Think of volatility as the “heartbeat” of a market. A calm, steady beat reflects low volatility, while a racing, irregular beat reflects high volatility.
In practice, traders and analysts often calculate volatility as the standard deviation of returns — a statistical way to measure how spread out price changes are. But you don’t need advanced math to spot volatility. If a stock moves 5% in a single day, that’s high volatility; if it moves 0.2% per day for weeks, that’s low volatility.
Historical vs Implied Volatility
Volatility comes in two major forms: historical and implied. Both are important, but they serve different purposes.
Historical Volatility (Realized)
- Definition: The actual price fluctuations observed in the past.
- How it’s measured: Typically calculated over a fixed window (e.g., 30 days) using daily price changes.
- Use case: Tells you how “wild” the asset has been recently.
- Example: If Bitcoin fluctuated between $20,000 and $25,000 in the past month, its historical volatility is high.
Implied Volatility (Expected)
- Definition: The market’s expectation of how much an asset will move in the future.
- How it’s derived: From the pricing of options — higher option premiums suggest the market expects bigger moves.
- Use case: A gauge of investor sentiment and uncertainty.
- Example: Ahead of Apple’s earnings, implied volatility on its options usually spikes because traders expect large swings, even if historical volatility was low before.
In short: historical volatility looks backward, while implied volatility looks forward. Traders often compare the two to identify whether options are cheap or expensive, or whether the market is under- or overestimating risk.
Why Volatility Matters for Traders
Volatility is a double-edged sword. It creates both opportunity and risk.
- Trading opportunities High volatility means bigger price moves, which can create profit opportunities for short-term traders. A 1% daily move in a stock may not excite day traders, but a 10% move definitely does.
- Risk management The same price swings that create opportunities also amplify risk. Volatile assets can wipe out poorly managed positions quickly. That’s why traders set stop-losses and carefully control position sizing in high-volatility environments.
- Strategy design
- Low-volatility markets often suit long-term investors, who prefer stability.
- High-volatility markets attract day traders and swing traders seeking fast gains.
- Options traders rely heavily on volatility measures to design strategies like straddles or spreads.
- Psychology Volatility tests emotions. Sharp swings can push traders into fear or greed, leading to impulsive decisions. Recognizing volatility as a natural part of markets helps maintain discipline.
In short, volatility is neither inherently good nor bad. What matters is how prepared you are to handle it.
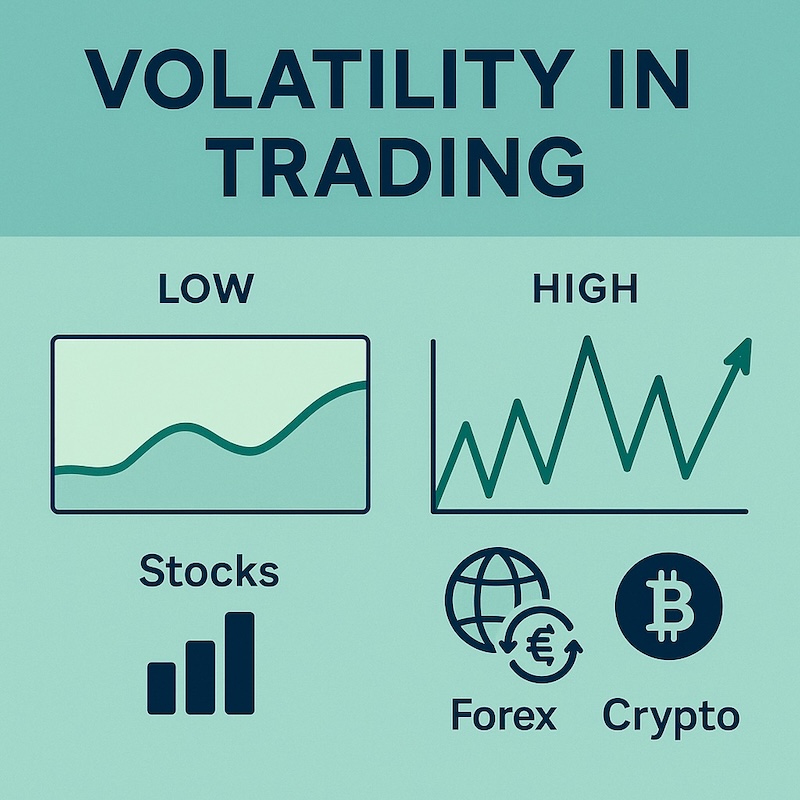
Examples: Stocks, Forex, Crypto
Volatility isn’t the same across all asset classes. Let’s look at a few popular markets.
Stocks
- Large-cap stocks like Microsoft or Johnson & Johnson tend to have lower volatility, moving a few percent over weeks or months.
- Small-cap or biotech stocks can jump or crash 20% in a single day on news, reflecting much higher volatility.
- Stock indices like the S&P 500 are generally less volatile than individual stocks because they are diversified baskets.
Forex
- Major currency pairs (EUR/USD, USD/JPY) are highly liquid and usually less volatile, often moving less than 1% in a day.
- Emerging market currencies (TRY, ZAR) can be much more volatile, reacting sharply to political or economic news.
Crypto
- Bitcoin and Ethereum are notoriously volatile compared to traditional assets. A 5–10% daily swing is not unusual.
- Altcoins can be even more extreme, with double-digit percentage moves happening frequently.
These examples show that volatility is relative: a 2% move may be huge for a currency pair but routine for a cryptocurrency.
Key Takeaways
- Volatility in trading is the measure of how much and how fast prices move.
- Historical volatility shows past price fluctuations, while implied volatility reflects market expectations of future movement.
- Volatility matters because it shapes both profit potential and risk exposure.
- Different markets have different volatility profiles: stocks, forex, and crypto behave in unique ways.
- Traders should adapt their strategies, position sizes, and psychology to the level of volatility in the markets they trade.
FAQ
What causes volatility?
Volatility is caused by changes in supply and demand. News events, economic data, earnings reports, and shifts in investor sentiment can all trigger sharp price movements.
Is volatility good or bad for traders?
It depends. Volatility creates opportunities for profit but also increases risk. Prepared traders can benefit, while unprepared traders may suffer losses.
Which market is the most volatile?
Crypto markets, especially smaller altcoins, are generally the most volatile. Traditional forex majors are the least volatile.
Can volatility be predicted?
Not precisely. Traders use measures like implied volatility and economic calendars to anticipate higher or lower volatility periods, but exact moves are unpredictable.
See also: Tradium trading guides and glossary.